Tracing
Vitess tracing #
Vitess allows you to generate trace events from major server components: vtgate, vttablet, and vtctld. OpenTelemetry is the tracing backend, exporting traces via OTLP/gRPC to any compatible backend. The legacy OpenTracing-based backends (opentracing-jaeger and opentracing-datadog) were removed in v25.
OpenTelemetry #
OpenTelemetry traces can be received by any OTLP-compatible backend, including Jaeger (v1.35+), Grafana Tempo, and Datadog Agent.
Configuring OpenTelemetry tracing #
To enable OpenTelemetry tracing, add the following flags to vtgate, vttablet, vtctld, or any other Vitess component:
--tracer opentelemetry --otel-endpoint localhost:4317
The available OpenTelemetry flags are:
--otel-endpoint: OpenTelemetry collector endpoint (host:port for gRPC). Defaults tolocalhost:4317.--otel-insecure: Use an insecure connection to the collector. Defaults tofalse.--tracing-sampling-rate: Sampling rate for traces (0.0 to 1.0). Defaults to0.1.
Running Jaeger with OTLP support #
Jaeger v1.35 and later natively supports OTLP ingestion on port 4317. You can run Jaeger with OTLP support using Docker:
$ docker run -d --name jaeger \
  -p 4317:4317 \
  -p 16686:16686 \
  jaegertracing/all-in-one:latest
Port 4317 receives OTLP/gRPC traces from Vitess, and port 16686 provides the Jaeger web UI.
Instrumenting queries #
You can instrument your queries to choose which queries (or application actions) generate trace events. This is useful when --tracing-sampling-rate is set to 0.0 and you want to trace only specific operations.
The SpanContext id you need to instrument your Vitess queries with has a very specific format. It is recommended to use the OpenTelemetry SDK to generate these. For reference, the format is a base64 string of a JSON object that looks like this:
{"uber-trace-id":"{trace-id}:{span-id}:{parent-span-id}:{flags}"}
Note the very specific format requirements in the documentation. Because of these requirements, it can be tiresome to generate them yourself, and it is more convenient to use the client libraries instead.
Once you have the SpanContext string in its encoded base64 format, you can then generate your SQL query/queries related to this span to send them to Vitess. To inform Vitess of the SpanContext, use a special SQL comment style:
/*VT_SPAN_CONTEXT=<base64 value>*/ SELECT * from product;
VT_SPAN_CONTEXT works with both text queries (COM_QUERY) and prepared statements (COM_STMT_EXECUTE). This means trace context propagation works regardless of which MySQL protocol your client library uses, including libraries that use prepared statements by default, such as PHP/Laravel, Python, and Go's database/sql with query parameters.
There are additional notes here:
- The underlying tracing libraries are very particular about the base64 value, so if you have any formatting problems (including trailing spaces between the base64 value and the closing of the comment), you will get warnings in your
vtgatelogs. - When testing with, for example, the
mysqlCLI tool, make sure you are using the-c(or--commentsflag), since the default is--skip-comments, which will never send your comments to the server (vtgate).
Inspecting trace spans #
Once you have configured tracing and instrumented (or enabled sampling for) some queries, you can access the tracing backend's web UI to look at the recorded spans.
If you are using the local Docker container version of Jaeger, you can access the web UI in your browser at http://localhost:16686/.
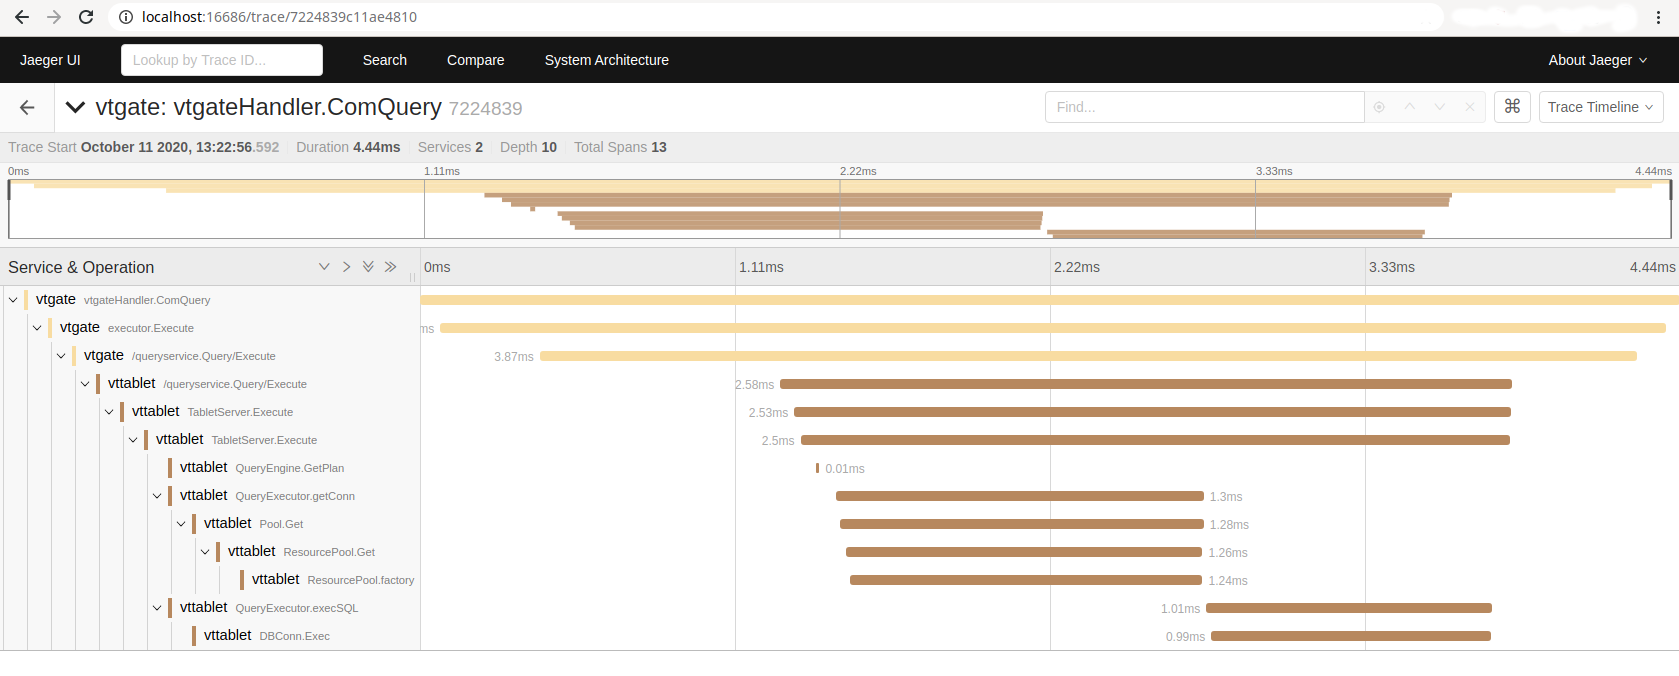
You should be able to search for and find spans based on the trace-id or span-id with which your query/queries were instrumented. Once you find a query, you will be able to see the trace events emitted by different parts of the code as the query moves through vtgate and the vttablet(s) involved in the query. An example would look something like this: